.svg)

TL;DR
- Scale exposes design gaps. Processes designed for a 10-rep team can't route information, enforce quality, or produce reliable data at 30 reps.
- The fix is architectural. Adding headcount, running more training, or buying another tool won't solve a process design problem.
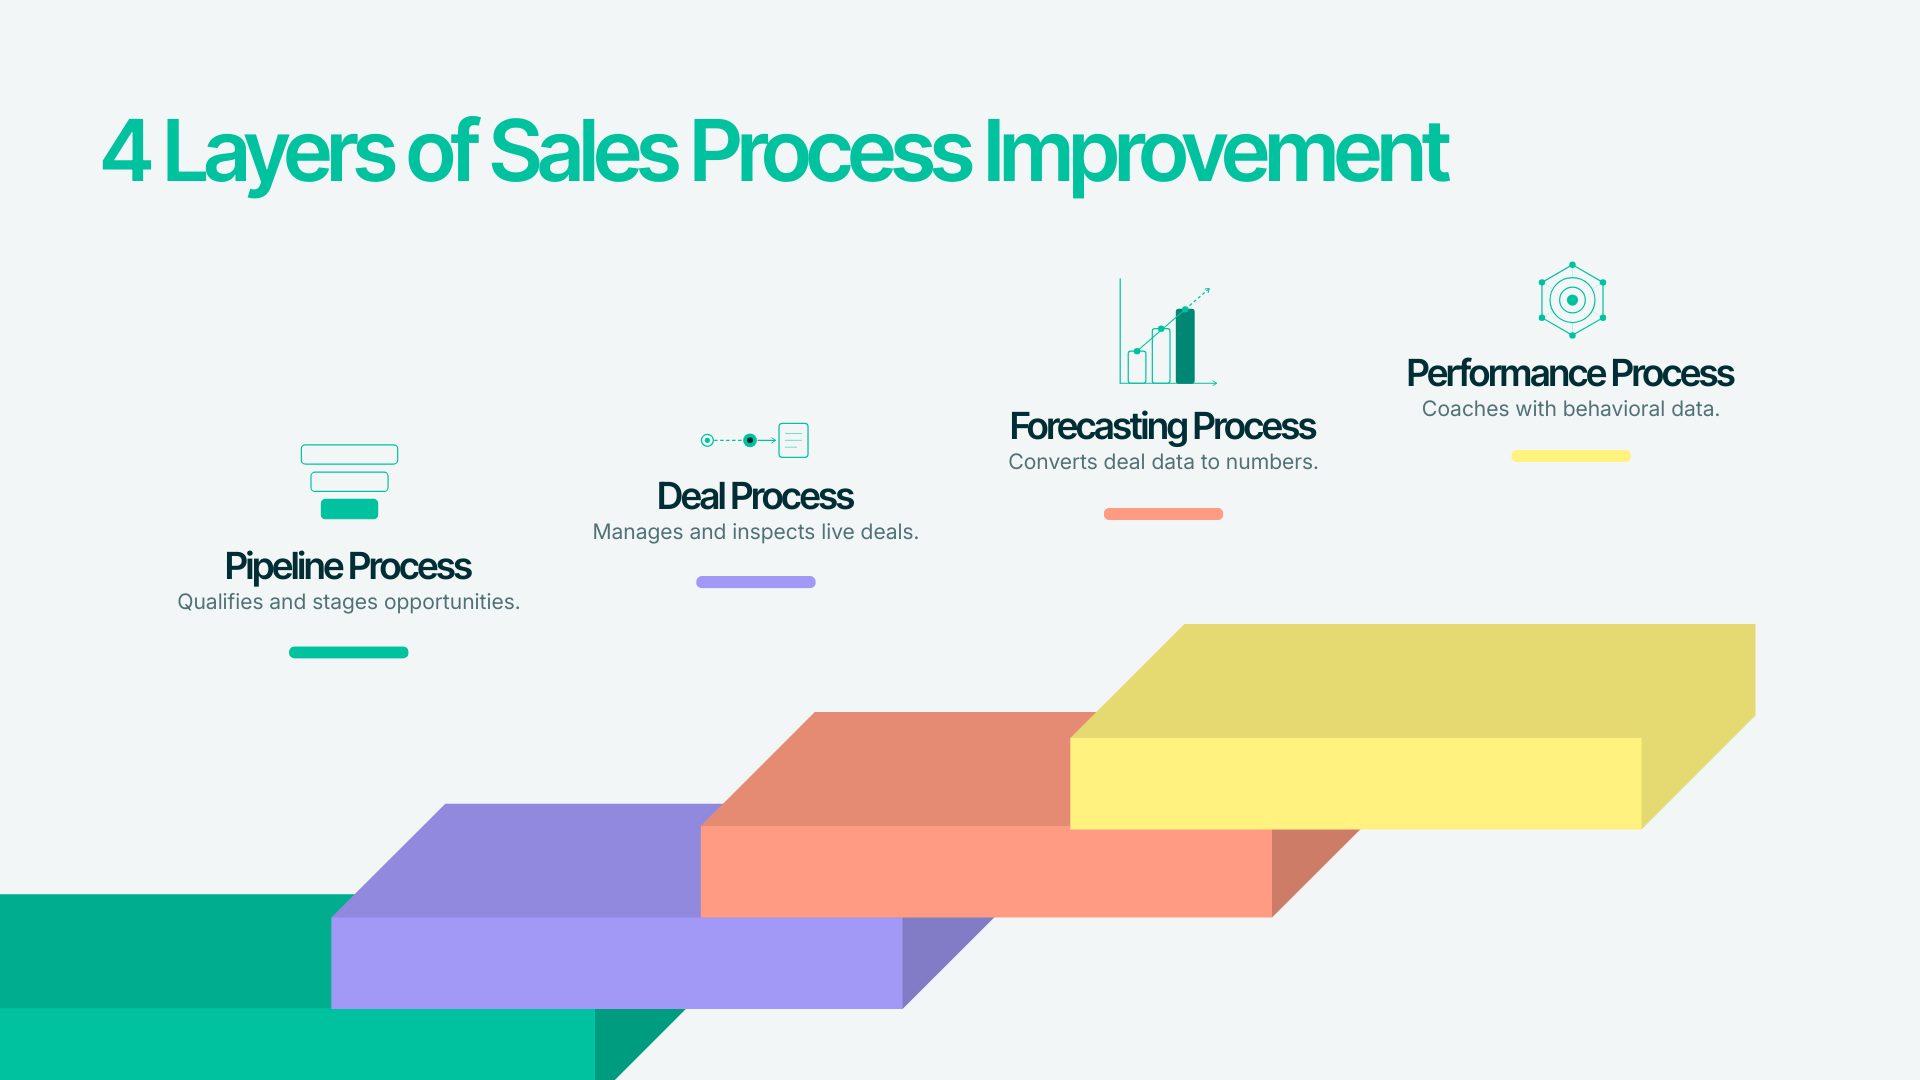
- Every scaling revenue org needs four process layers: Pipeline (how deals enter and stage), Deal (how opportunities are managed), Forecasting (how deal data becomes a defensible number), and Performance (how managers coach to behavioral data).
- Process adoption failure is a design problem. Reps don't resist processes; they resist processes that cost them time without giving them anything back.
- Measure process health before it hits revenue. By the time quota attainment drops, the process has been broken for two or three quarters. Leading indicators (CRM completeness, stage conversion rates, forecast variance) catch it earlier.
- Don't try to fix all four layers at once. Run a quarterly cadence: audit, diagnose, pick one thing, ship it, measure. One adopted change compounds. Five ignored changes don't.
Revenue wasn't growing fast enough. Leadership decided to add headcount.
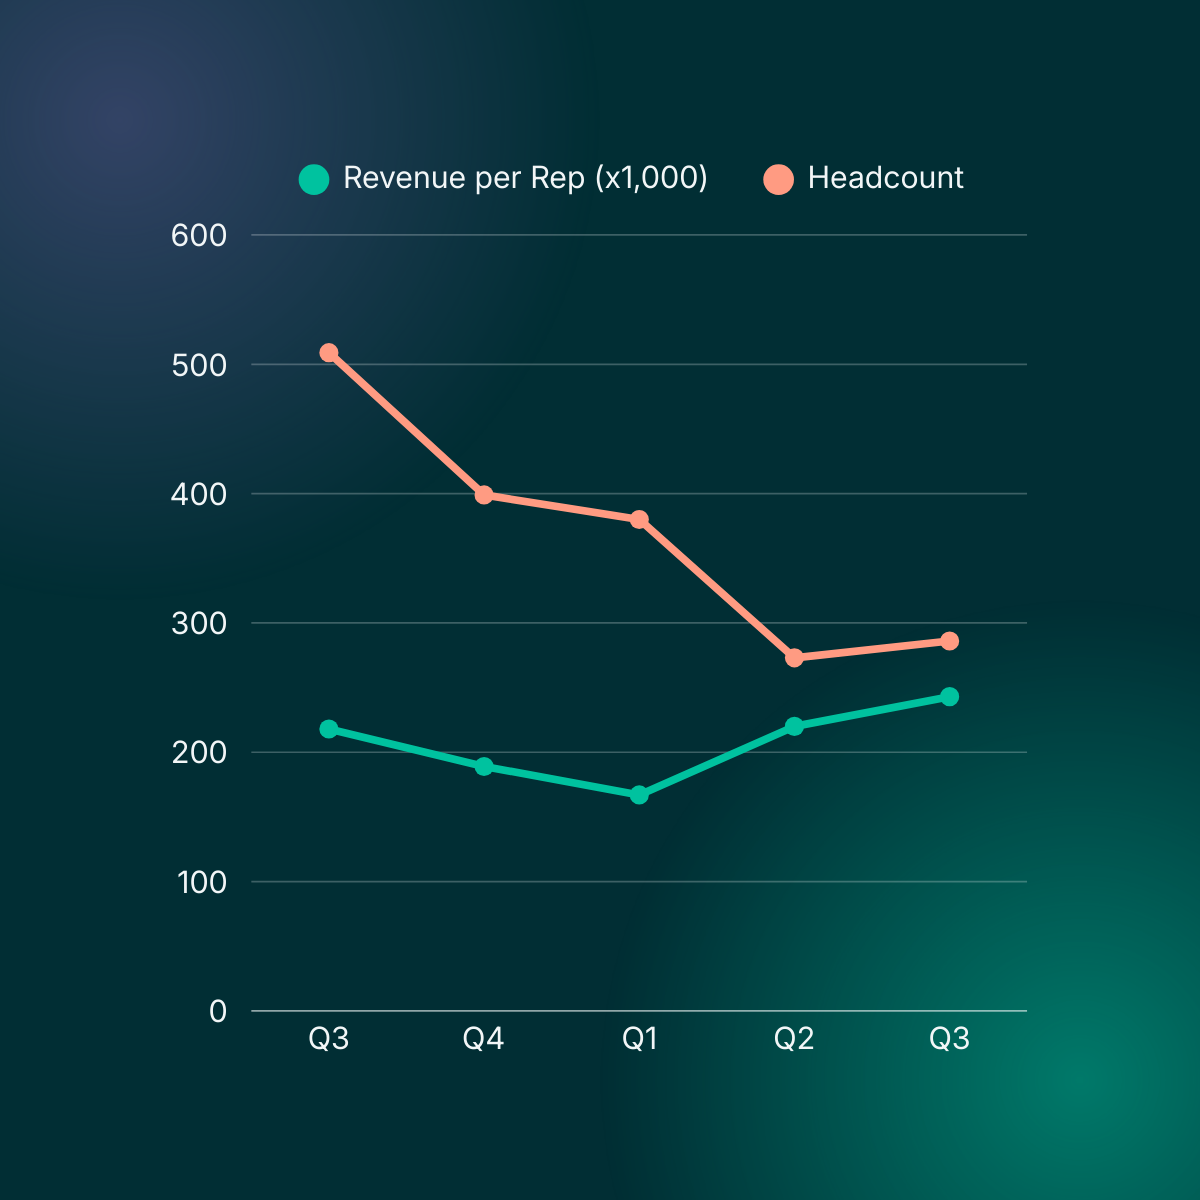
This was one software company doing what every company in this position does. At its peak, their sales organization grew to 500+ people. Revenue per rep kept declining.
Then leadership made a counterintuitive decision: over the next year, they cut the sales org in half, reduced headcount from 509 to 286. Revenue per rep went up 11%.
The headcount was masking a broken process instead of driving growth. With more reps running a flawed motion, the org had simply scaled failure. They spread process debt across a larger team, generated more noise, and made the underlying problems harder to see and fix. Jacco van der Kooij, who documented this case, puts it plainly: "As these companies quadruple their sales teams, they scale failure."
Now think about the last time you sat in a board meeting and had the same conversation. Revenue is flat or declining. Sales says the team needs better leads. Marketing says the leads are fine, and Sales just isn't closing them. The CRO looks at the CRM and can't tell who's right because the data isn't clean. Everyone agrees the forecast is probably wrong. And nobody can say exactly why.
So leadership does what leadership does: they add headcount. And fail to scale.
It’s easy to blame this failure on the team, but the real problem is the architecture underneath them. The processes that worked at 10 reps can't route information, enforce quality, or produce reliable data at 30—and just forget about 50. Growth doesn't create process problems. It exposes the problems that were always there.
This guide is for the leaders who recognize that pattern and want to fix the architecture, not just the symptoms.
Sales Process Scorecard
Want to Go Straight to Getting a Scorecard? Use the app below to run a quick sales process audit
Is a PDF workbook more your style?
Download the Revenue Process Audit Checklist →
What Improving Your Sales Process Actually Means
Most people think "sales process improvement" means doing the same things faster. Shorter sales cycles. Fewer steps. Better tools. Faster reps.
That's efficiency in the manufacturing sense: unit of output per unit of time. It's a useful metric on an assembly line. A revenue organization needs a better frame.
In a revenue org, process improvement means building systems that produce consistent, repeatable outcomes regardless of who's running them. The goal is predictability: any rep following the defined process produces results the CRO can plan around.
That distinction matters because most process interventions target the wrong thing. They optimize for activity (calls made, emails sent, stages moved) rather than for system design (how information flows, how you enforce quality, how you capture data). You end up with reps who are busy in ways that don't compound.
Process debt is the accumulation of design decisions that make sense at 10 reps but break at 30. Every revenue organization carries some. The question is whether it's being paid down or compounding.
Comparing Effort and Consistency is a useful way to diagnose where your team sits:
Most teams at a growth inflection point are in the top-left. Their intervention instinct moves them to the top-right: more structure, more requirements, more enforcement. The goal of this guide is the bottom-right: less friction, higher adoption, better outputs.
Why Sales Processes Break at Scale
Most teams misread process failure. Before diagnosing and fixing, it's worth understanding the failure mode more deeply.
The standard narrative is that processes break because reps don't follow them. The reality is that reps don't follow processes that weren't designed for them. There's a difference, and it matters for what you do next.
Consider a company at $12M ARR with five account executives. The VP Sales runs weekly pipeline reviews with each rep personally. She knows every deal. She spots problems early. She coaches in context. The CRM is a little incomplete, but it doesn't matter much—she already knows what's in there. The forecast comes from her judgment, and her judgment is good.
Now fast-forward to $45M ARR and 22 reps. The VP can't know every deal anymore. The weekly reviews are now 30-minute group calls where reps share updates. This means reps share what makes them look good, not what's actually happening. The CRM is supposed to fill the gap, but 76% of it is inaccurate or incomplete according to research by Validity across 602 companies. The forecast is still built on judgment, but now that judgment is four levels removed from the actual deals.
Nothing broke. The VP didn't get worse at her job. The reps didn't get lazier. The processes that worked at $12M simply weren't designed to route information, enforce quality, or produce reliable data at $45M. Scale exposed the design gap.
Mark Roberge (founding CRO at Hubspot) describes this pattern in The Science of Scaling: "Once we hit that supposed product-market fit, we raise a Series A, hire 10 salespeople, and attempt to 'triple, triple, double, double.' Instead we 'strike out' 80% of the time."
The fix isn't training, or a new CRM, or even a performance improvement plan. It's an architectural diagnosis: which layer of the process is broken, and what does it need to work at the current scale?
The Four Sales Process Layers
Every scaling revenue organization needs four distinct process layers. Most have some version of all four, but they're usually incomplete, misaligned with each other, or designed for a team size that no longer exists.
The four layers are...
- Pipeline Process: how opportunities enter, get qualified, and progress through stages
- Deal Process: how individual deals are managed, inspected, and unblocked
- Forecasting Process: how deal data gets converted into a number the business can plan around
- Performance Process: how managers use process data to develop reps
Each layer depends on the one below it. If the pipeline process produces bad data, the deal process works from bad inputs. If the deal process is inconsistent, the forecasting process guesses. If the forecasting process is unreliable, the performance process has nothing real to coach to.
This is why point solutions fail. Adding a forecasting tool to a team with a broken deal process doesn't improve forecast accuracy; it just automates the guess.
Layer 1: Pipeline Process
The pipeline process governs how opportunities enter the funnel and what it means to be in each stage. This sounds basic. In practice, it's where the most common failure happens.
Salesforce stages look clean on a slide. In real life, ask five different reps what it means for a deal to be in "Discovery" and you'll get five different answers. Rosalyn Santa Elena (ex-Head of RevOps at Clari) describes this pattern from every organization she's joined:
"Everybody has sales stages in their opportunities, and they look great. They're well-defined, they look good. It looks like people are using them. And then you peel back the covers and look. If you ask a handful of reps, they don't know what they mean."
When stage definitions are subjective, stage data is meaningless. And when stage data is meaningless, everything built on top of it (deal reviews, forecasts, pipeline coverage ratios) is also meaningless.
A well-designed pipeline process defines stages by buyer actions, not seller activities. "Sent proposal" is a seller activity. "Prospect confirmed budget and timeline in writing" is a buyer action. One is within the rep's control and easy to fake; the other reflects actual deal momentum.
Signs Your Pipeline Process Is Broken
- Pipeline reviews rely on rep narrative rather than data
- Stage conversion rates vary dramatically across reps with similar territory profiles
- More than 30% of deals in "late stages" haven't had rep activity in 14+ days
- CRM data is inconsistent enough that leaders don't trust it
Layer 2: Deal Process
Top performers are 588% more likely to follow a consistent methodology than average performers. A strong deal process governs how the team manages individual opportunities from qualified to closed. This is where the actual work happens, and it’s where most revenue gets lost without anyone noticing—until it's too late.
A functioning deal process answers three questions for every active opportunity: What's the current state of the deal? What's the next action that moves it forward? What could block it?
Most teams answer the first question through rep narrative in pipeline reviews. The second and third are often left entirely to rep judgment. This is fine when you have two reps and a VP who knows every deal personally, but it doesn’t cut it when you have 20 reps and a VP running 90-minute all-hands pipeline reviews.
A scalable deal process makes the structure explicit and visible:
- Multi-threading requirements: at what deal stage is a single-threaded deal considered at risk?
- Activity minimums: what does "active engagement" look like for deals in each stage?
- Inspection triggers: what conditions automatically surface a deal for manager review?
- Exit criteria: what has to be true before a deal advances to the next stage?
The goal isn't compliance for compliance’s sake. The goal is making it possible for a manager to look at any deal in the CRM and understand its actual status.
Layer 3: Forecasting Process
Fewer than 50% of sales leaders have high confidence in their organization's forecast accuracy, according to Gartner research. This process problem starts two layers below.
The forecasting process converts deal-level data into a number the business can plan around. When it works, leaders can say with confidence what they expect to close this quarter, why, and what the range of outcomes is. When it doesn't, they're averaging gut feelings from reps who are averaging gut feelings from their own deal assessments.
A reliable forecasting process has three components:
1. Consistent Input Format
Every deal entering the forecast should carry the same data: stage, expected close date, deal value, last meaningful buyer action, and the specific next step. Reps who fill this in consistently produce forecastable deals. Reps who don't produce noise.
2. Weighting Methodology
Stage-based probability (the default in most CRMs) is almost completely unreliable as a forecasting input; it reflects where the rep thinks the deal is, not what's actually happening. Better approaches weight deals on behavioral signals: recency of buyer engagement, number of stakeholders involved, whether key qualification criteria are met, etc.
3. Variance Tracking Cadence
You need to compare the forecast to actual outcomes every quarter and document the variance. Teams that do this systematically get better at forecasting. Teams that don't do this fail to build institutional knowledge about where their forecasts go wrong.
The forecasting process connects directly to the pipeline health work in Layer 1. The accuracy of your forecast is largely determined by the quality of the deal data feeding it. This is why we treat pipeline health and forecasting accuracy as dependencies, rather than as separate problems. Many modern RevOps teams are now adopting Demand Intelligence vs ABM frameworks to improve buyer-signal visibility, account prioritization, and forecasting accuracy across the revenue process.
Layer 4: Performance Process
The performance process governs how managers use data to develop reps. This is the layer most organizations build last, if at all.
In practice, most sales coaching is reactive and narrative-based. A deal falls out. A manager asks what happened. The rep explains. The manager offers perspective. Repeat. This approach has two structural problems: 1) it's backward-looking (the deal already lost), and 2) it's based on self-reporting (which isn't neutral).
A data-driven performance process changes both inputs. Instead of asking reps what happened on lost deals, managers look at behavioral patterns across all deals: which stages have the highest drop rates for this rep? Where does deal velocity slow? Are multi-threading requirements being met? Is CRM hygiene consistent?
This is the layer where behavioral intelligence becomes an operational input rather than an aspiration. Reps spend only 40% of their time actually selling. The other 60% goes to admin, internal meetings, and non-selling tasks. A performance process built on activity data alone optimizes for that 60%. One built on deal-level behavioral signals tells managers what's actually happening in the 40% that matters.
Coaching with behavioral data requires that Layers 1-3 are functioning. You can't analyze deal engagement patterns if the data isn't clean. You can't identify forecast variance if the forecasting process isn't documented. The performance layer is the result of getting the architecture right.
Designing Sales Processes Reps Actually Follow
Reps don't follow processes that cost them more than they return. If entering MEDDPICC fields in Salesforce takes 15 minutes and produces no visible benefit for the rep's next conversation, reps will skip it; the ROI is negative from their point of view. They're optimizing for their goal (closing deals) using the information available to them (that the CRM entry costs time and doesn't help them sell).
Design principle 1: Every required field should serve the rep first, manager second.
Before mandating a data field, ask: does knowing this help the rep prepare for their next conversation? If the answer is no, you're designing for yourself, not your rep. Data captured for reporting purposes rarely gets captured accurately. Data captured because it helps reps sell gets captured because reps have an incentive.
Design principle 2: Reduce input, increase output.
Most process design increases the burden on reps (more required fields, more stage gates, more review meetings) in exchange for better visibility for managers. The better trade is investing in systems that auto-capture what reps would otherwise enter manually (email activity, meeting cadence, stakeholder engagement) so reps get visibility into their own deal health without the data entry cost.
Design principle 3: Make the invisible visible.
The most effective process changes don't add steps. They surface information reps already needed but couldn't see. Which of my deals haven't had buyer-side activity in 10 days? Which deals are single-threaded going into a complex evaluation? Which stage am I losing deals I shouldn't be losing? When reps can see this, they act on it because it helps them.
This is how the design philosophy shows up in practice:
The adoption question answers itself when the process is designed this way. Reps don't resist processes that help them sell. They resist processes that don't. The sales org in the introduction of this guide had hundreds of reps following a process that looked right on paper and produced nothing. The fix wasn't more enforcement. It was a smaller team running a better-designed motion.
Measuring Process Health Before It Hits Revenue
Most sales organizations measure outcomes: quota attainment, win rate, average deal size, revenue per rep. These are real metrics that matter. They're also lagging indicators; by the time they move, the process has usually been broken for two or three quarters.
Process health metrics are the leading indicators. They tell you the process is failing before the revenue data does.
The RevOps KPI stack has three tiers:
Tier 1: Process Input Metrics
These measure whether the process is being followed at all.
Tier 2: Process Adherence Metrics
These measure whether the process is working as designed.
Tier 3: Process Output Metrics
These are the outcomes, but they should be read in context of Tiers 1 and 2.
The diagnostic value is in reading the tiers together. If quota attainment drops (Tier 3) but stage conversion rates and CRM completeness are stable (Tiers 1 and 2), the problem is likely external: market conditions, competitive pressure, or ICP fit. If Tier 1 and 2 metrics are degrading, the process is broken and the Tier 3 outcomes are a lagging reflection of that.
The Tech Stack Trap
Sales reps use an average of eight tools to close a deal, and 42% describe themselves as overwhelmed by the number of tools they're managing. The overhead of navigating multiple systems doesn't just cost time. It creates data fragmentation: each tool captures a piece of the customer relationship, no single system has the whole picture, and the CRM that's supposed to be the system of record ends up as the system of last resort.
Most organizations buy tools in response to problems. The pipeline isn't visible? Buy a pipeline analytics tool. Reps aren't logging calls? Buy an activity capture tool. The forecast keeps missing? Buy a forecasting platform. Each purchase is rational in isolation. Together, they create complexity and kill scale.
The pattern looks like this:
Problem surfaces →
Tool purchased to fix it →
Tool requires its own process →
Team doesn't follow new process →
Original problem persists →
New tool purchased
The fix isn't necessarily fewer tools. You need tools that follow the process, rather than a process that follows the tools.
Tech Stack Questions to Ask Before Purchasing
- Does this tool fit into the process we've already designed, or does it require building a new process around it?
- Does it capture data automatically, or does it require manual input from reps?
- Does it write back to the CRM, or does it create a parallel data silo?
- Does it give reps something useful in their selling workflow, or only give managers reporting?
A well-designed tech stack is nearly invisible to reps. It captures activity automatically. Deal data flows between systems without manual entry. The tools surface insights reps actually use rather than generating reports only managers read.
The principle here is simpler: design the process first, then choose tools that support it. Every other order of operations creates technical debt.
Building Your Process Improvement Roadmap
The most common mistake in process improvement is trying to fix everything at once. Transformations that span all four layers simultaneously almost always fail. It’s not that the diagnosis is wrong; it’s just that the organization's capacity to absorb change is finite.
The teams that make lasting improvements run a quarterly cadence: one layer, one fix, measured outcome, repeat. The case in the intro is an extreme version of this principle. Leadership didn't try to fix all four layers simultaneously. They removed the headcount that was obscuring the problem and fixed the motion itself. The results compounded.
This a four-step framework you can use to build your sales process improvement roadmap:
Step 1: Audit
Run a structured diagnostic across all four process layers. The Revenue Process Audit Checklist (available below) provides the specific questions, but the goal is to identify where the biggest gap exists between what the process is supposed to do and what's actually happening.
The audit should include…
- A data completeness review in the CRM
- Rep interviews about where the process creates friction
- A pipeline analysis looking at stage conversion anomalies
- A forecast variance review from the last two quarters.
Step 2: Diagnose
Convert the audit findings into a layer-by-layer assessment. Which layer has the most critical failure? In most organizations at the $25M–$50M ARR inflection point, the answer is Layer 1 (pipeline process). Inconsistent stage definitions and low CRM data quality corrupt everything downstream. Fix the foundation first.
Step 3: Prioritize
Pick the single most important thing in the single most broken layer. Process improvements compound over time, but only if they stick. One change that actually gets adopted is worth more than five changes that create friction and get ignored.
Step 4: Ship and Measure
Only 11% of sales organizations can drive commercial success while also executing a transformation. The difference between the 11% and the rest is almost always execution discipline; the organizations that succeed change less at once and measure more carefully.
Implement the change, define what success looks like in 90 days, and track it. If the change works, it becomes the new baseline. If it doesn't, you have data to understand why before adding complexity on top of it.
The quarterly cadence looks like this:
The result won’t be a finished revenue process. It'll be a process that never stops improving.
Where to Start
The org that cut its sales team in half didn't do it because they gave up. They did it because they finally understood that adding people to a broken process is just making the problem bigger. The audit is how you find out which part is broken.
If you've read this far and recognized your organization in more than one section, the instinct is to prioritize everything simultaneously. Resist it. The most useful thing to do next is run the audit. You need a focused diagnostic that identifies which layer is most broken and what fixing it would require.
The Sales Process Audit Checklist is designed for exactly that. Twenty-five questions across the four layers, with scoring that identifies your primary failure mode and the highest-leverage starting point. Take it into your next leadership meeting, or use it as the foundation for a RevOps planning conversation.
Download the Revenue Process Audit Checklist →
If you need to see how behavioral intelligence closes the gap between the process you've designed and what's actually happening in the field, Chief can help. It tracks deal-level behavioral signals that tell you where the process is working, where it isn't, and which specific opportunities are at risk right now. Chief can even recommend what to do next based on the situation.
Try Chief free to try designing your own custom agent assignments.